
Project Overview
Comparing design hours, meeting hours against the estimated time
The Question
Is there a way to use actual data to get better estimates?
When you’re starting a new project and writing a statement of work, the timeline usually starts with a number someone comes up with. An educated guess based on how long the last project took, or how big this one feels. Educated, maybe. But still a guess.
Then the project wraps, and that number rarely gets a second look.
Meanwhile, Figma has been quietly keeping track of everything, every save, contributor, timestamp, and file. The data is already there. It just wasn’t answering the question.
So I built something that could.
What it is
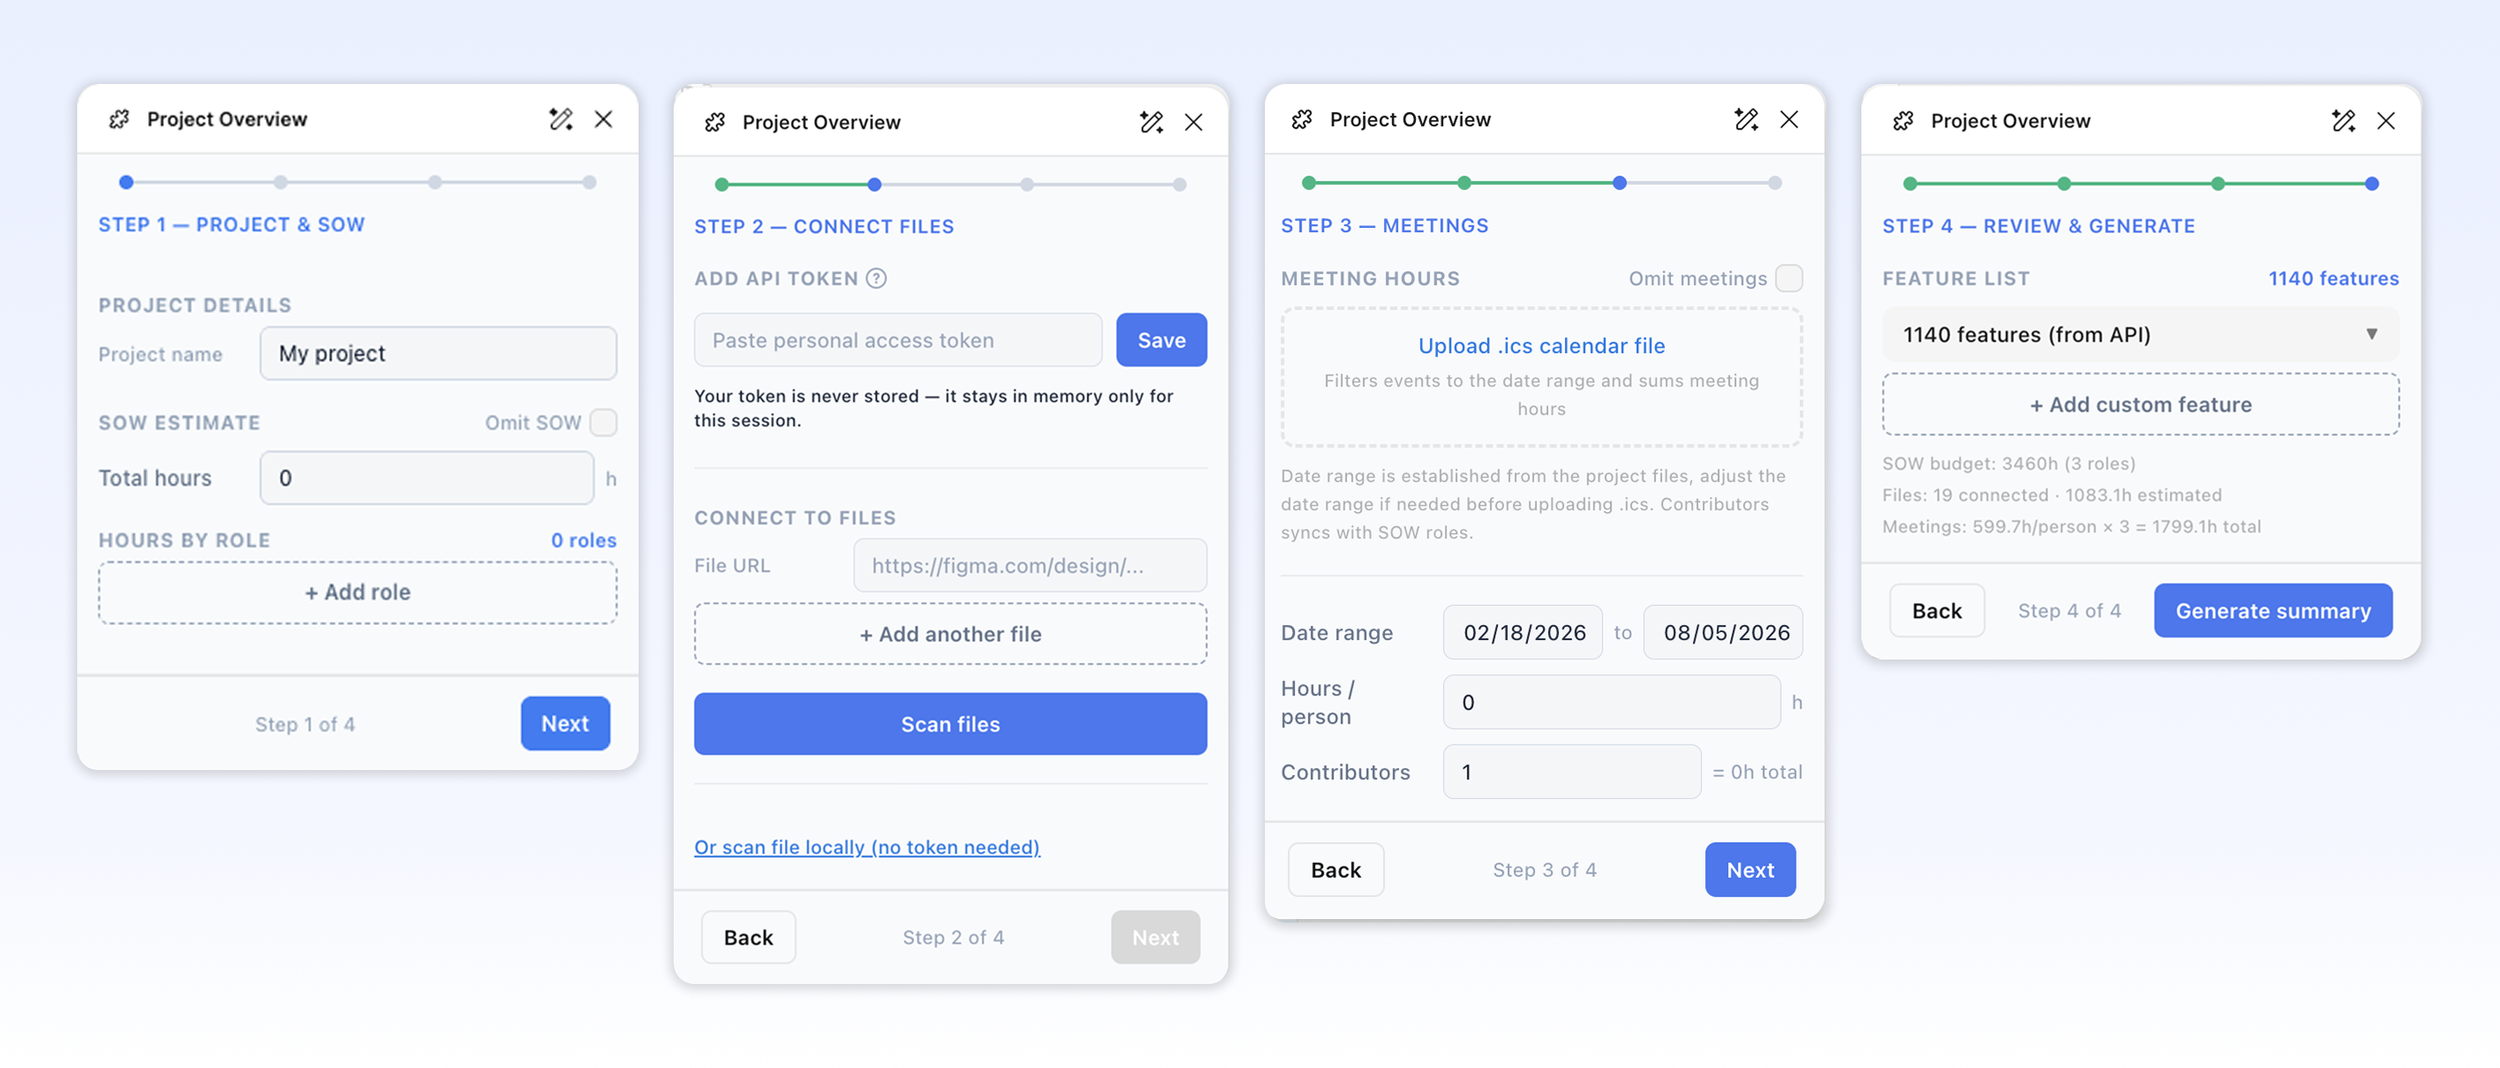
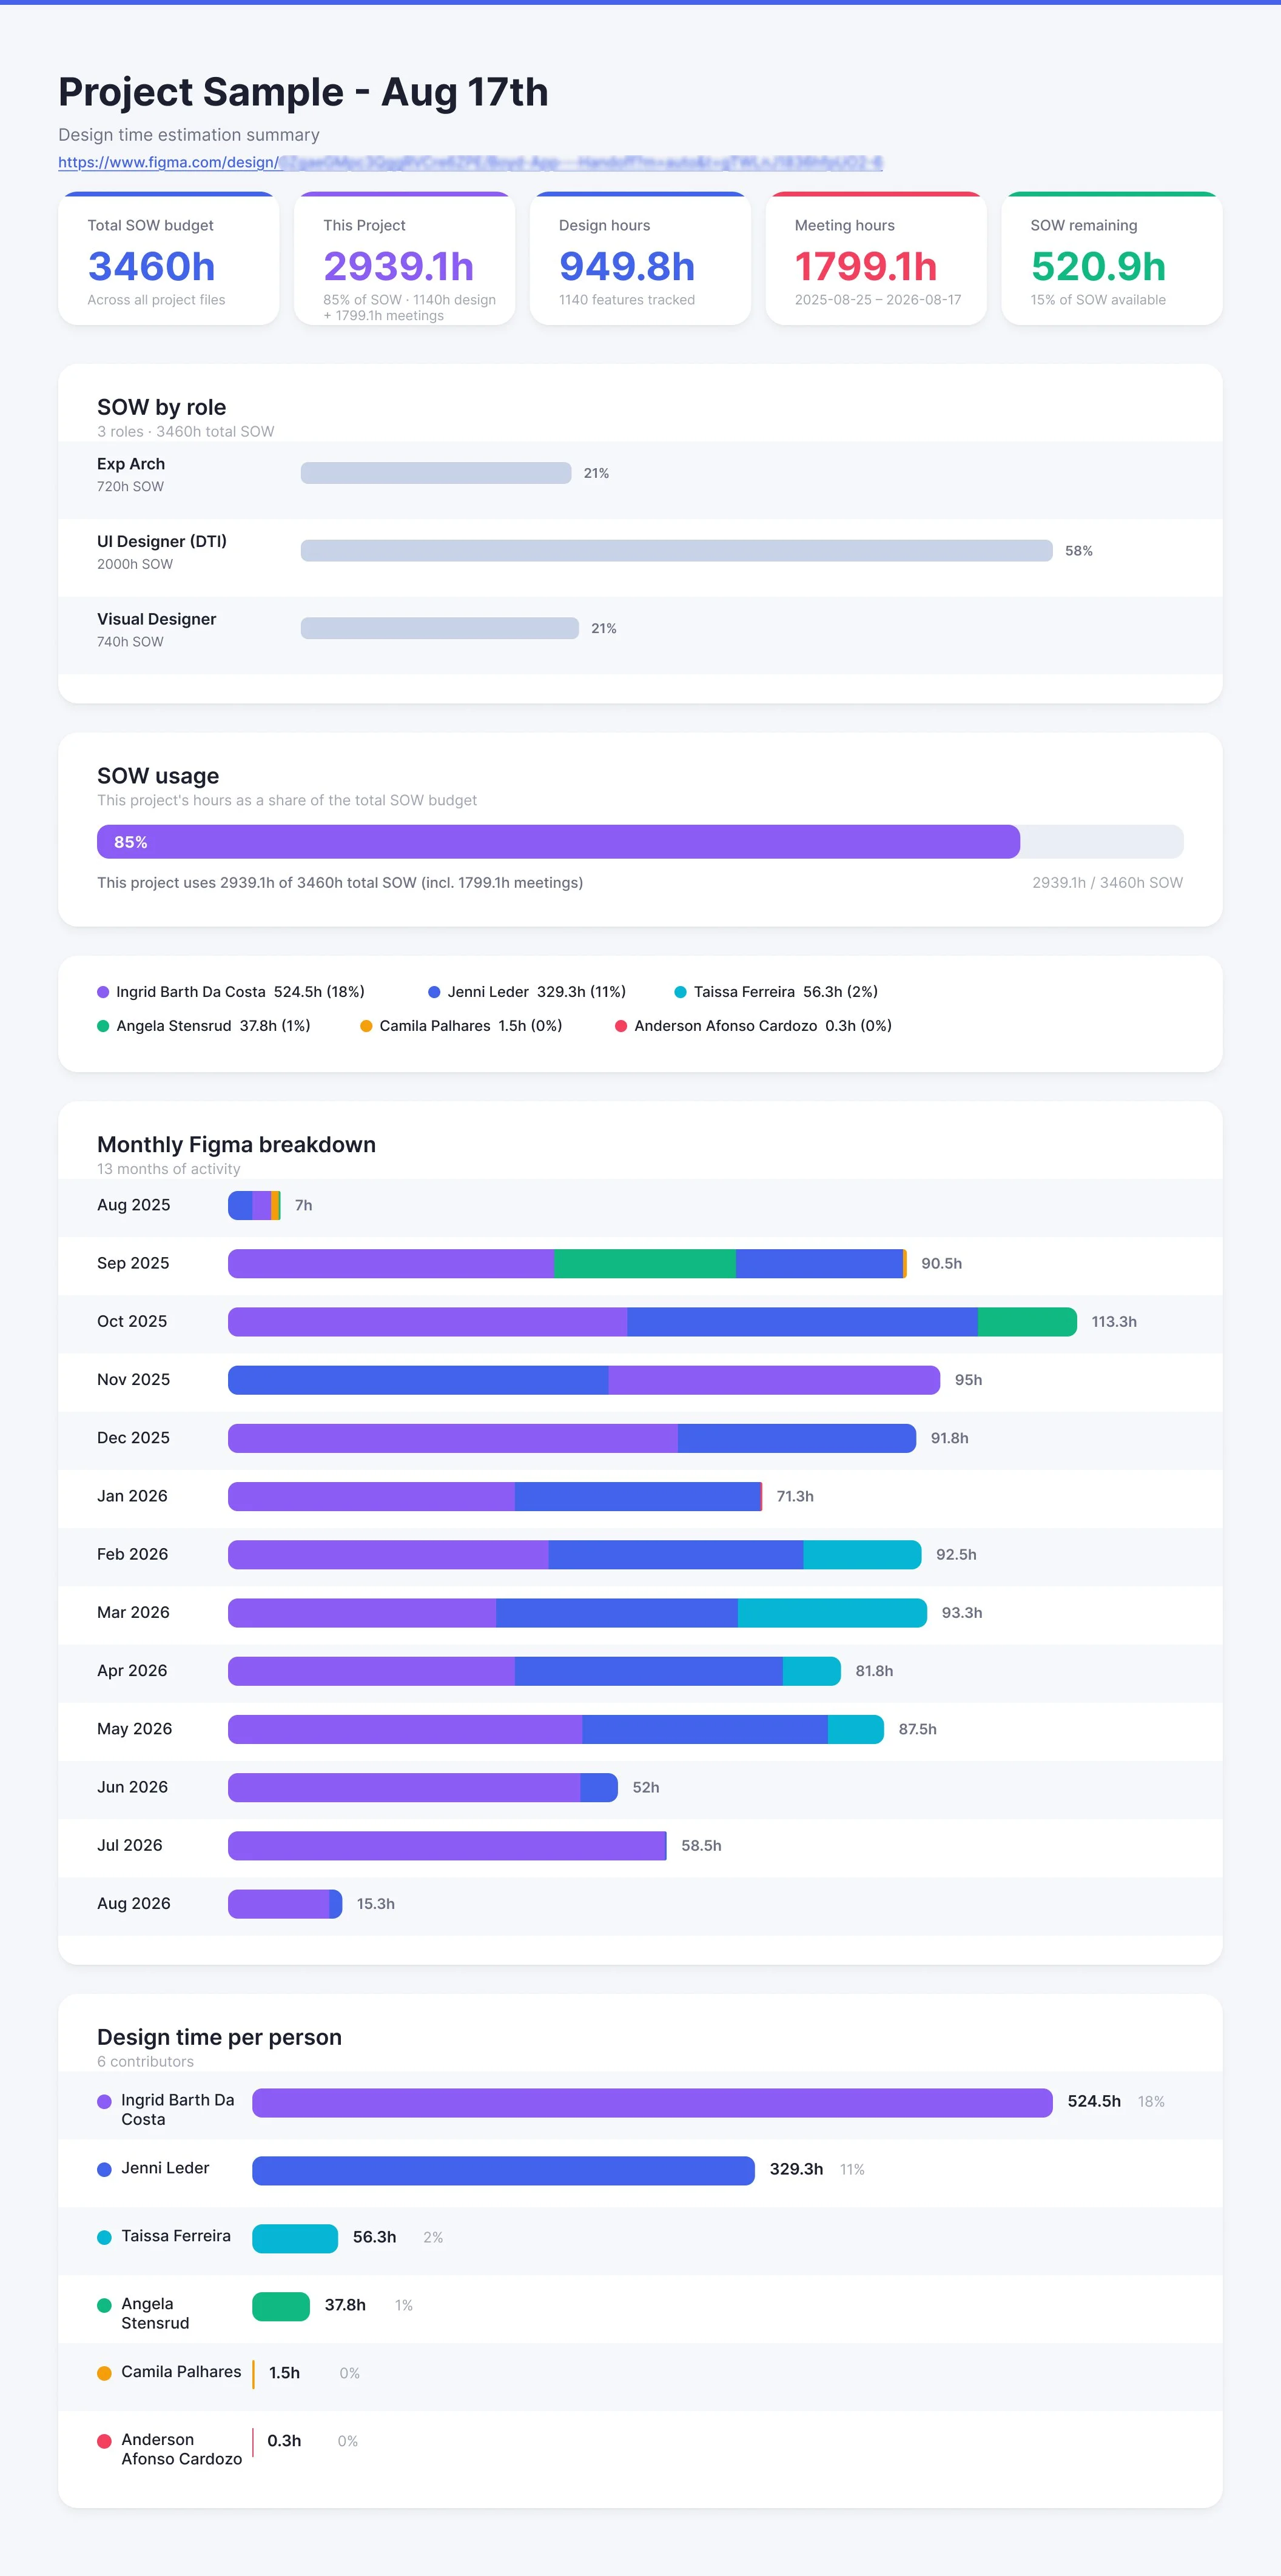
Project Overview is a Figma plugin that reads version history across one or more files and generates a project dashboard on your canvas. SOW budget against estimated actuals, variance, effort by month, by person, by role, by feature, down to the individual screen.
Four steps and a Generate button:
Project and SOW. Total hours, then hours split by role.
Connect files. Paste a Figma personal access token, drop in file URLs, scan. FigJam, Make, and Slides links work too. As many files as you need.
Meetings. Add hours by uploading an .ics export and let it tally the meetings that fall inside the project's date range. Since people on the project are in the same meetings, one calendar can do a rough estimate of everyone’s meetings.
Review and generate. Check the auto-detected feature list, add custom features, ship it.
How it started.
It started with a coworker who was using the Figma Agent to review a project she had just finished. One of the things she was looking at was how much time she had actually spent on it. She was the smarty who connected Figma’s version history to the time she had worked, using the timeline Figma gives you and screenshotting it.
Her project was only about a month long, so there weren’t that many screenshots to deal with.
But it got me thinking: How much time had I actually spent on one of my projects? And did that line up with what we had estimated in the statement of work?
The project I wanted to test was over a year long. I started screenshotting the version history and pretty quickly realized I was going to be doing this forever. So I did some digging and found out that Figma’s version history data could be accessed through the API using a personal token.
That was the lightbulb moment. Instead of manually collecting screenshots, I could pull the data and actually build something around it.
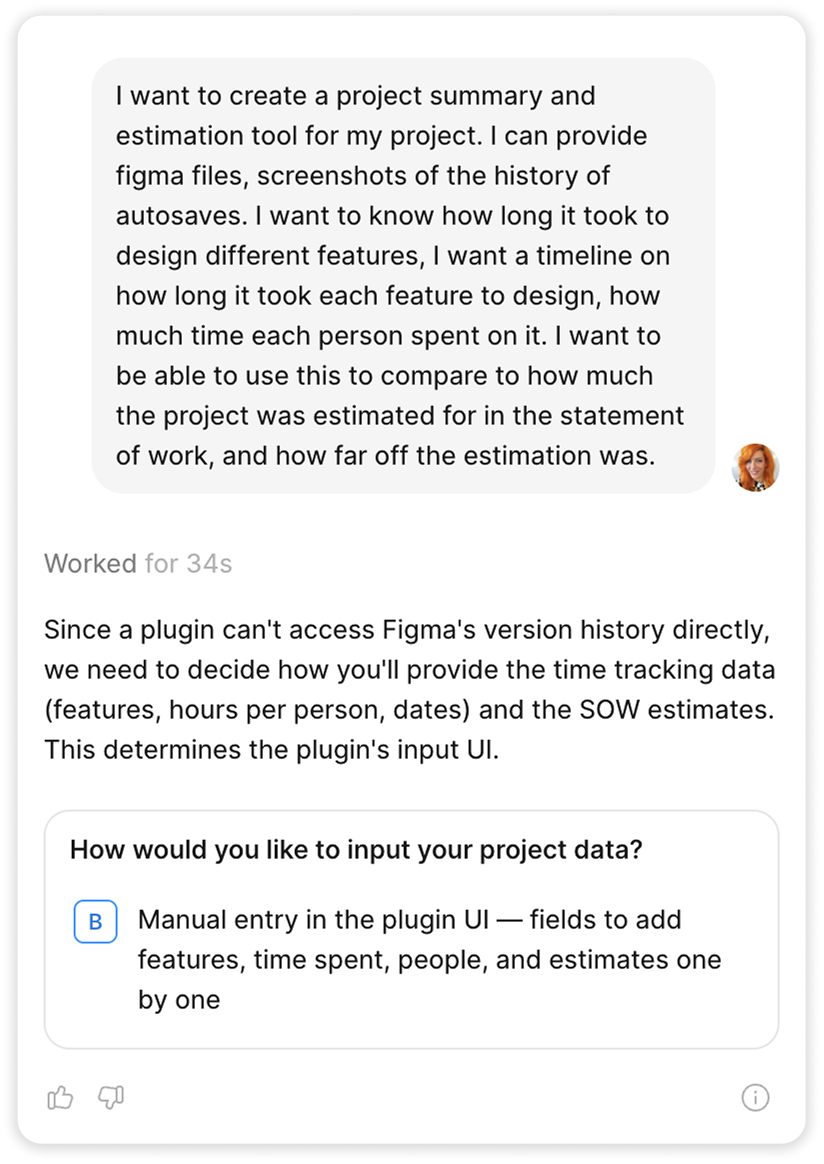
I used the Figma Agent to build the plugin. I’d describe the behavior I wanted, get the plugin code back, run it against real project files, watch it inevitably get something wrong, and then fix it.
The hard part was figuring out the definitions. How should the plug-in scan the file? What counts as a work session? Can the file organization be used to determine the design time on a feature? Those decisions are what ultimately determine the numbers.
Building it with an agent meant I could actually test those decisions instead of pitching an idea and hoping I was right. I could change the session threshold, re-scan a year of real project history, and see if the results still lined up with what I remembered about the work.
That feedback loop was probably the most interesting part for me. I’ve never really had a way to test an estimating question like that before.
How the estimating actually works
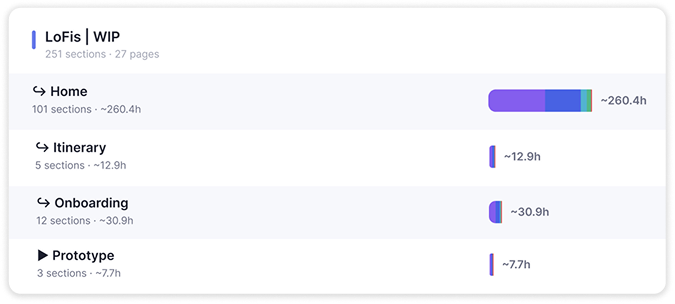
Figma’s version history is basically a trail of saves: who made them and when. When the plug-in scans the files, it can see who has worked on the file and when they worked. Add up those sessions, and you get an evidence-based estimate of hours worked. It’s not tracked time, but it’s a pretty close for what actually happened.
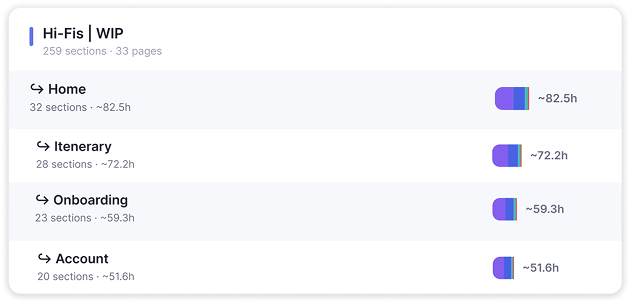
Designers are already organizing their files by feature, so why not use that structure? The plugin rolls the time up by file, then breaks it down page by page, section by section, all the way to the frame.
As I was playing with the plug-in, the numbers kept coming in low next to what we'd estimated. It took me a minute to realize what was missing. Meetings. Meetings eat as much time as the design work, sometimes more. So I added the ability to add an .ics file from your calendar. It takes the dates from the version history and grabs all the meetings within that time period. That was the missing piece.
Publishing the Plugin
This is where I discovered that building a plugin and publishing a plugin are two very different things.
When you create a plugin with the Figma Agent, you’re essentially creating something for yourself to use. You can build it, test it, and run it on your own files, but you can’t just hit a button and publish it from that same panel.
To actually publish it, I had to export the plugin and essentially start over in a more traditional plugin setup. And, of course, not everything came along for the ride. A lot of the visual UI choices I had made in the original version didn’t carry over, so there was another round of cleaning things up, restyling the interface, and making sure everything still worked the way it had before.
Then there was a whole new set of questions I hadn’t really thought about yet: Where do I publish it? What settings do I need? How do I set up the plugin listing? What does Figma actually need from me?
Thankfully, the Figma Agent was still pretty useful here. It walked me through a lot of the setup and helped me figure out the pieces I hadn’t encountered before.
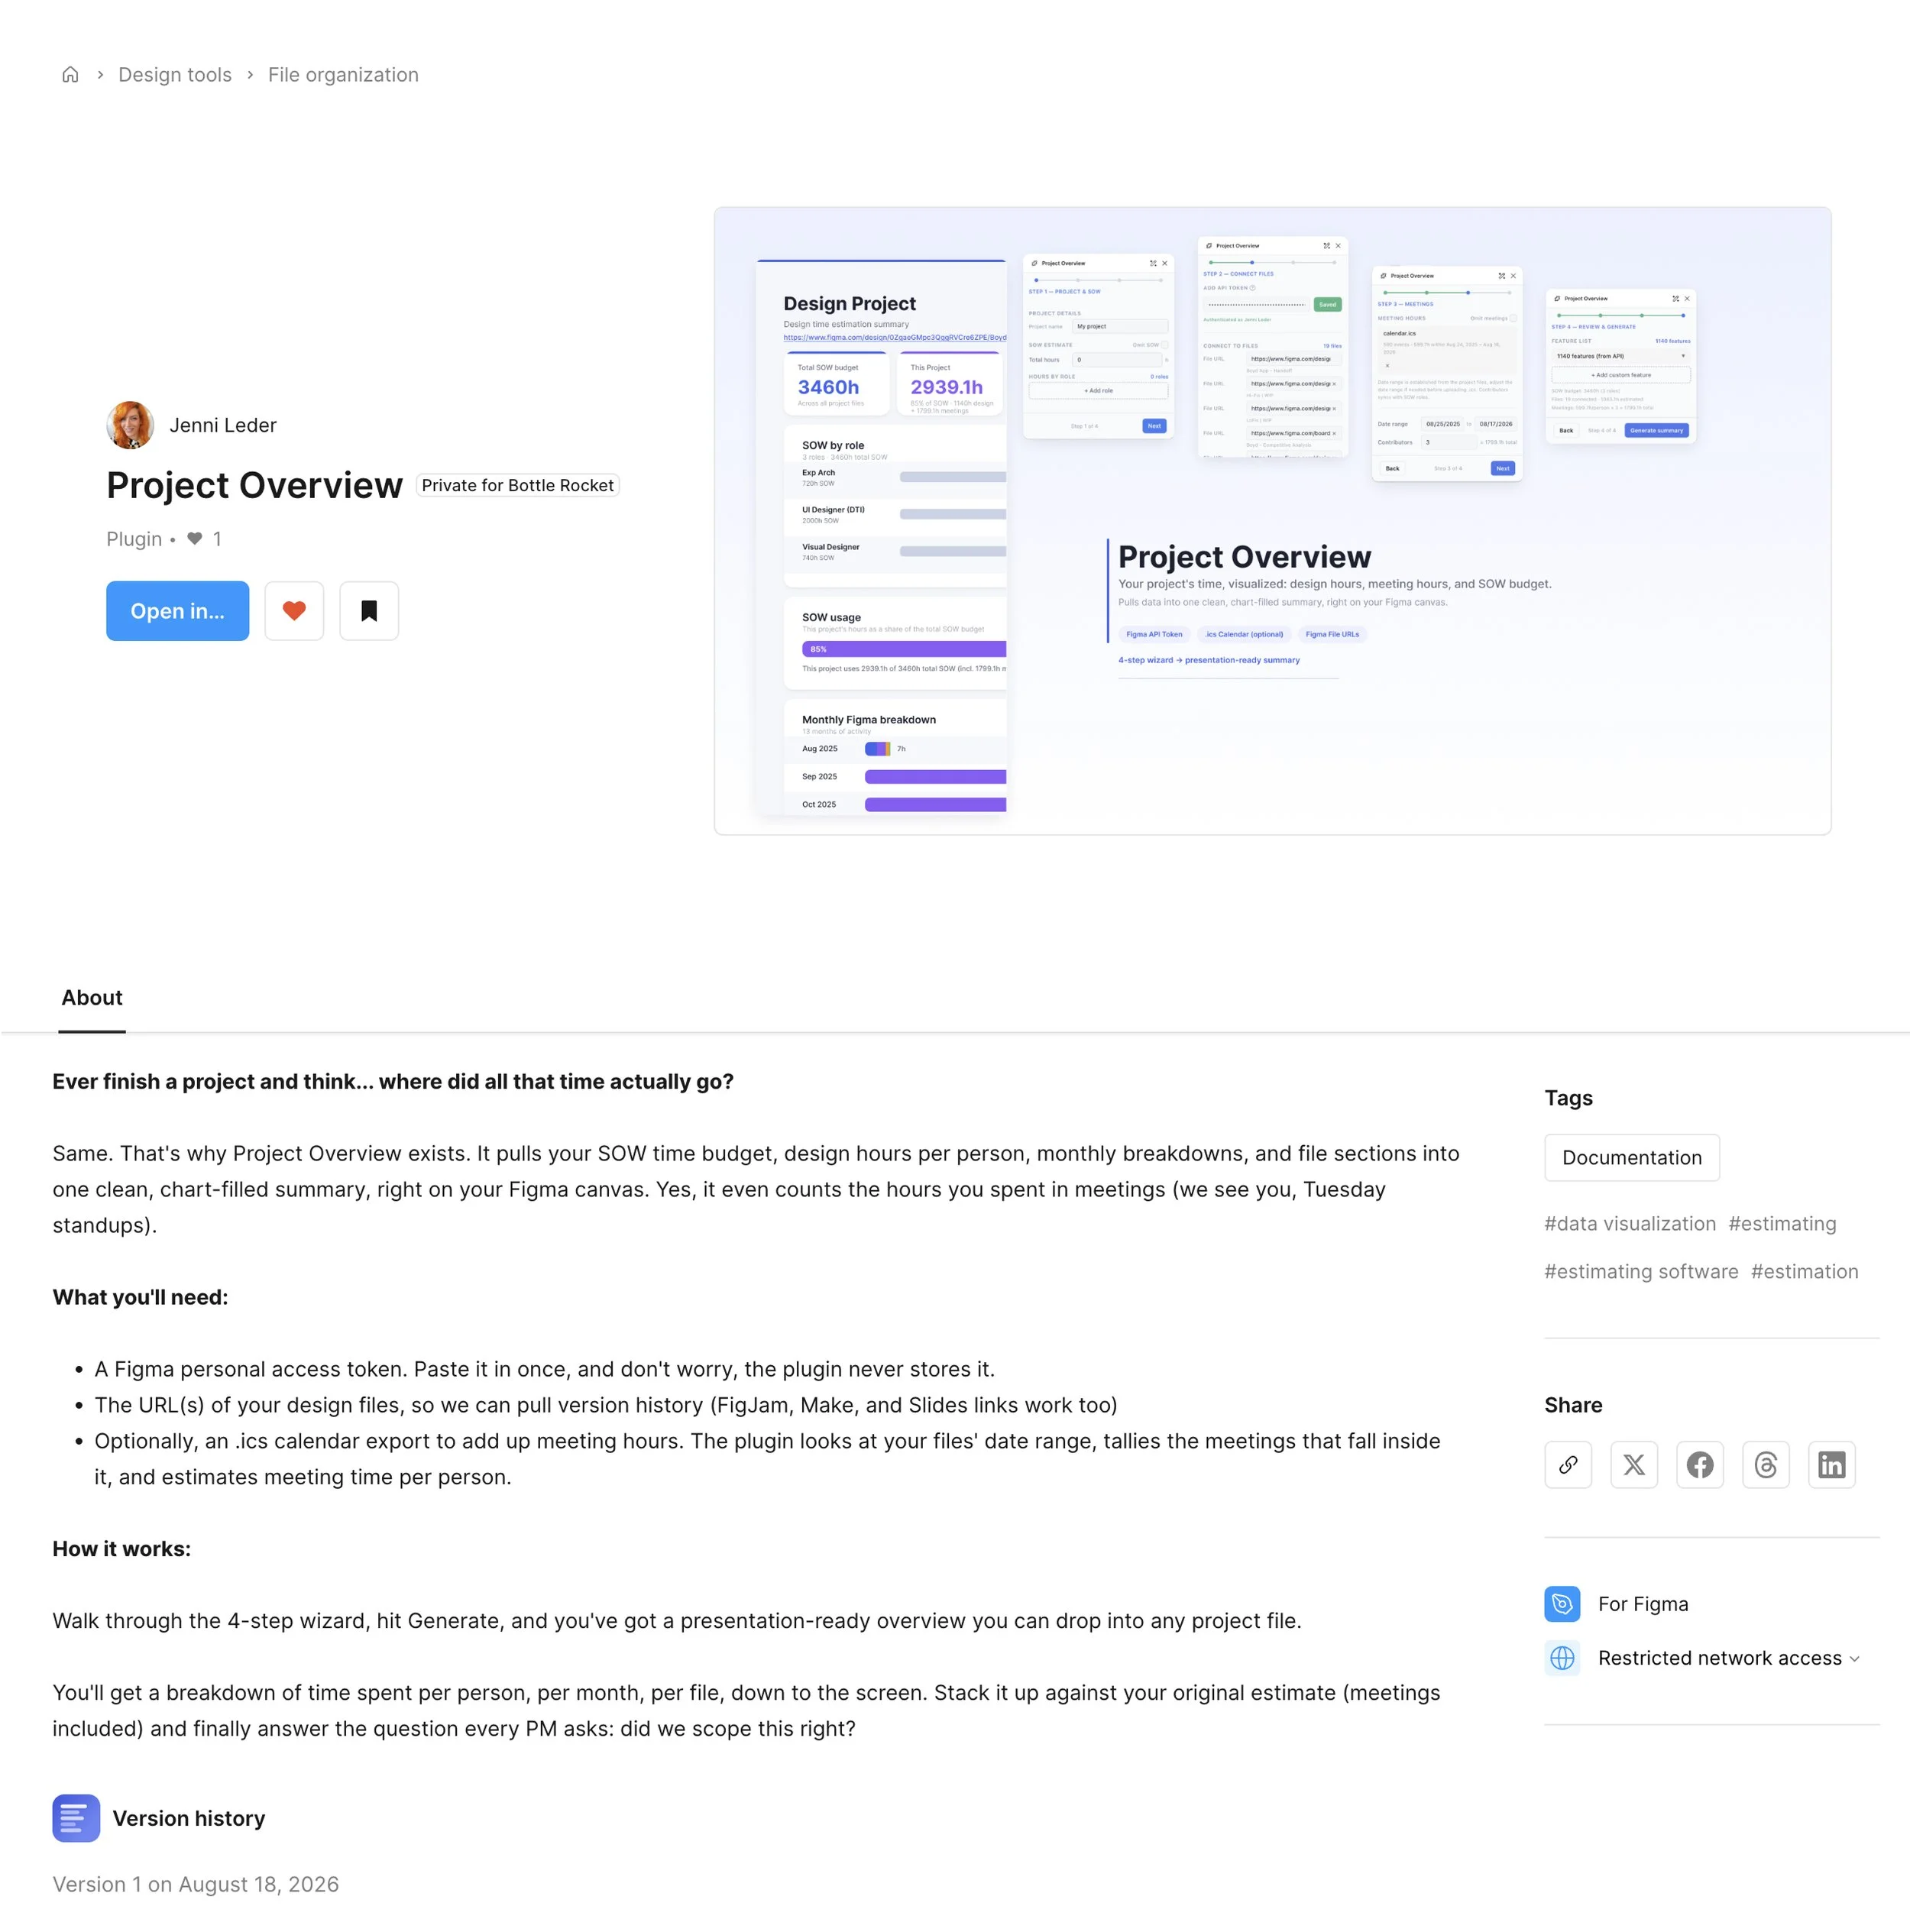
I also discovered that Figma gives you the option to publish a plugin just within your own Figma organization instead of making it available to the entire Figma Community. That felt like the right fit for this one. The plugin was built around a pretty specific Bottle Rocket problem, so I kept it internal.
Maybe with some reworking, it could become something useful for a broader audience. But for now, it does exactly what I built it to do, and that was enough.